Make Ur Move founder, Alexandra Morris, gives a personal view on the budget and interest rate changes as a landlord.
The Renters’ Rights Act 2025 represents the most significant overhaul of England’s private rented sector in decades, turning decades-old practices on their head and reshaping how landlords and tenants interact. In this latest proeprty article Make Ur Move review the changes and how private landlords can prepare.
A guide for landlords on the incoming Renters' Right Bill. Get up to date information as we await Royal Assent on the likely changes and what you need to do now.

In this blog, Make Ur Move helps to highlight why allowing pets in your rental house or property could be a game-changer—and how you can make the most of it as a UK landlord.
A summary of the autumn statement and impacts specific to landlords from online letting platform Make Ur Move Limited.
In this blog, we'll analyse the UK's average rental prices from April 2022 to April 2023, providing landlords with a benchmark figure for their area.

Discover the top 5 compelling reasons why landlords are increasingly turning to outsourcing property management for a seamless and stress-free rental experience.

Join us as we explore the Manchester rental market and unearth fascinating statistics such as average rental prices.

Join us as we explore how we save fully managed landlords over £1,000 per year.
It’s been four years in the making, but this week the Renters Reform Bill has finally been published by the government. Here we will summarise what we know so far, provide insights from industry experts and answer the question - is it such bad news for landlords?
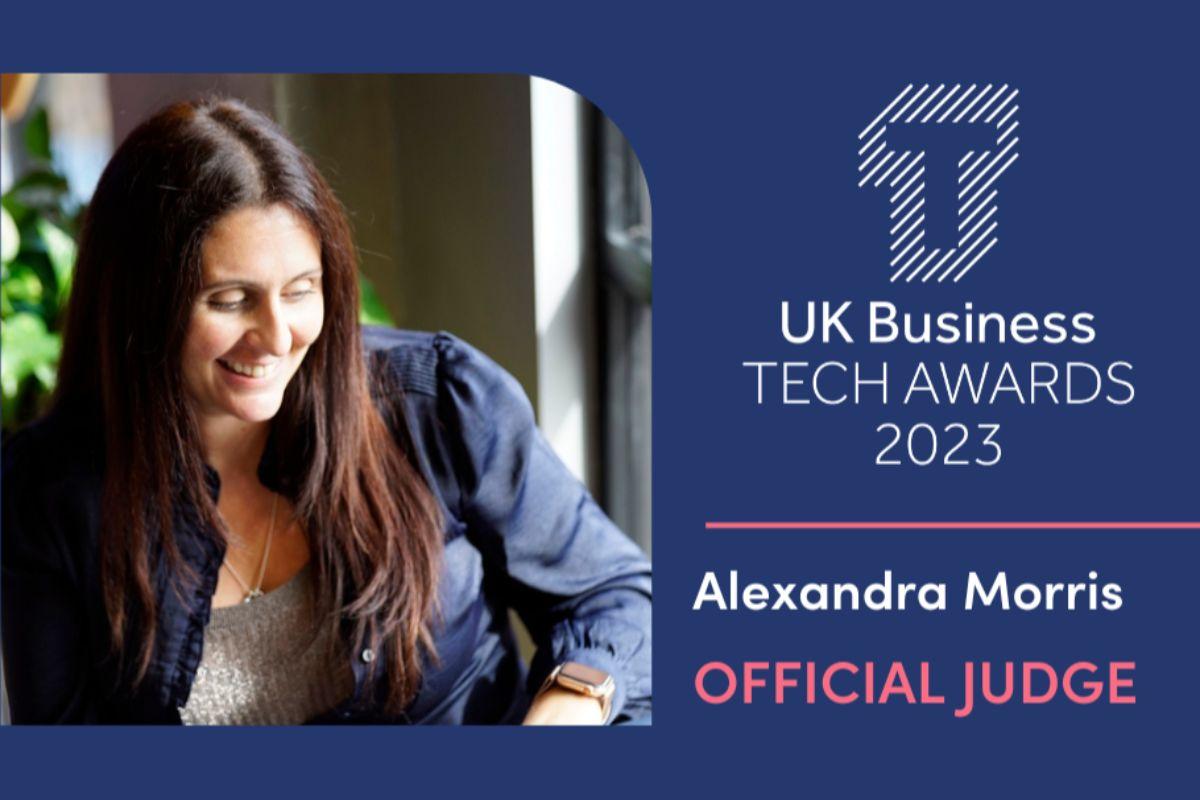
It is a great pleasure to announce that Alexandra Morris, the Managing Director of MakeUrMove, has been chosen as a judge for the UK Business Tech Awards 2023.
The Secretary of State for Levelling Up, Housing and Communities Michael Gove has confirmed via an interview with Sky News that the Renters Reform Bill will be published next week.

