Are you considering allowing tenants to own pets in your rental property?

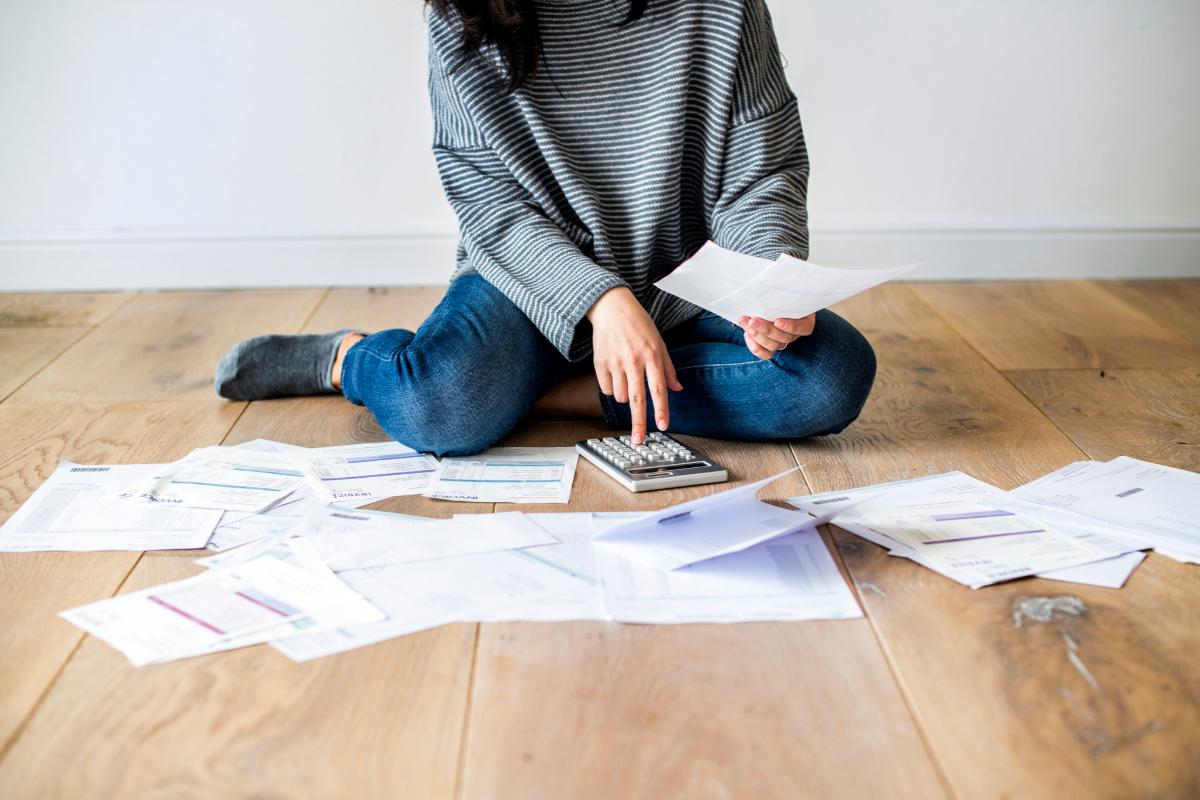
Non-payment of rent can cause a lot of stress and financial issues, here are 5 expert tips for resolving rent arrears.
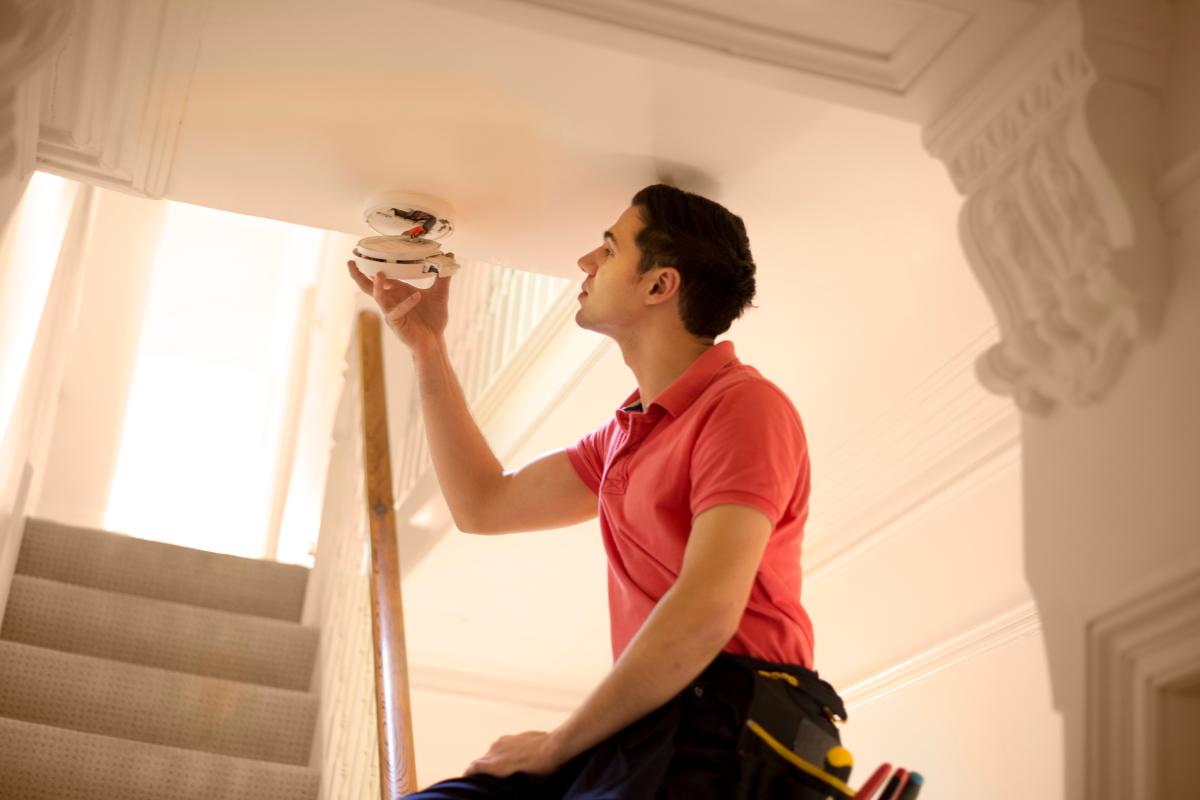
One of the biggest anxieties for landlords and tenants is the risk and consequences of fire. This is why smoke detectors are so important.
If you are struggling to pay your energy bills during the winter months, you could be eligible for the Warm Home Discount scheme, which means you may be able to take £140 off your electricity bill.
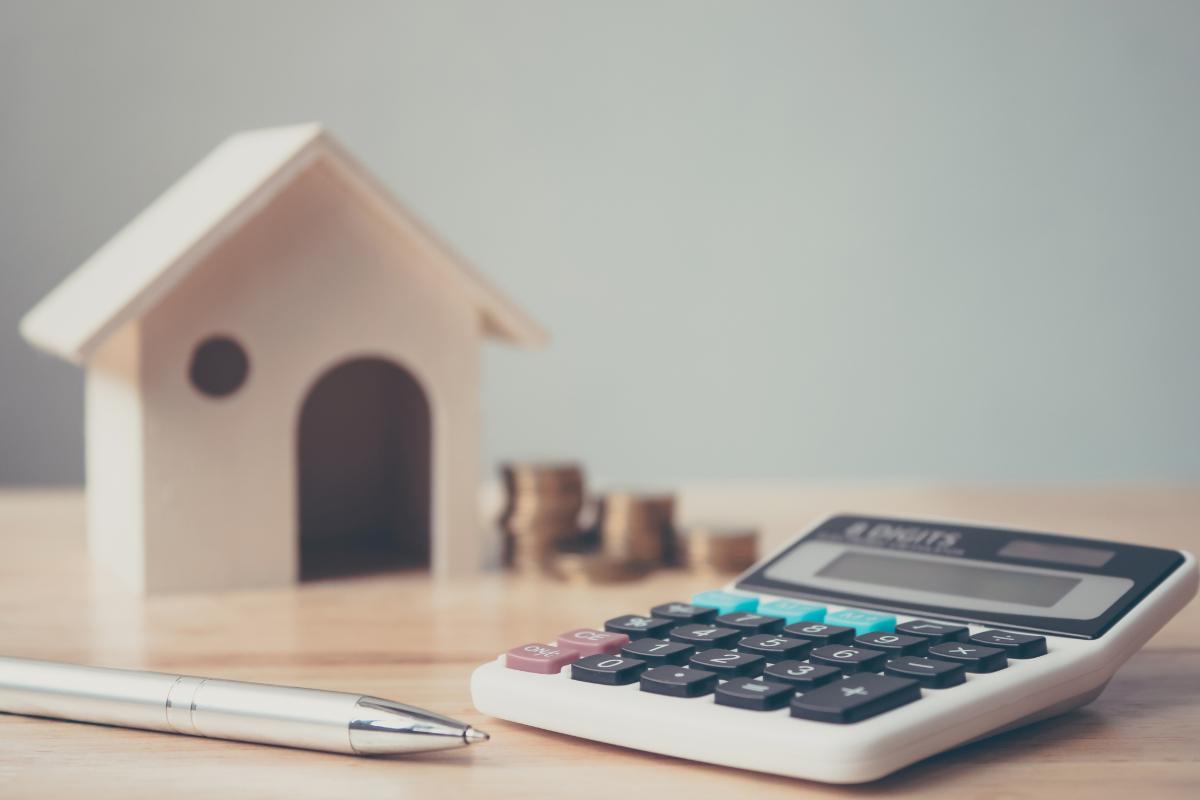
With changes to cash deposits as part of the Tenant Fees Ban, the way deposits are handled both before and during tenancies has changed.

As a landlord you know you're responsible for providing your tenant with a safe and fit place to live. Something which can crop up which you may not consider is controlling pests.

Screening of tenants is one of the most effective ways to increase profitability by saving you time and money. The pre-viewing screening will present you with a shortlist of the best tenants. You can then go ahead and schedule viewings.

From 1st June, on existing tenancies that are renewed, landlords will need to return any deposit amount held that exceeds the new 5-week deposit cap. We have partnered with Zero Deposit to bring landlords a smarter deposit solution.
Rent is a common cause of disputes between landlords and tenants. What's the best way to collect the rent? How can you make the whole process easier? And what can you do if the tenant falls into arrears?

The Tenant Fees Ban have come into force on 1st June 2019. The Act limits the fees that private landlords and letting agents are allowed to charge tenants. Here are some FAQs regarding the Tenant Fees Act based on various scenarios.

Serving proper notices is important when it comes to staying compliant and protecting yourself from any miscommunications. Here are 7 kinds of notices landlords should know.

When this happens, it puts you as a landlord in a difficult position. What are the ramifications for both you and your tenant if your tenant is subletting your property?

